


Rev’s Transcript Library
Explore our extensive collection of free transcripts from political figures and public events. Journalists, students, researchers, and the general public can explore transcripts of speeches, debates, congressional hearings, press conferences, interviews, podcasts, and more.
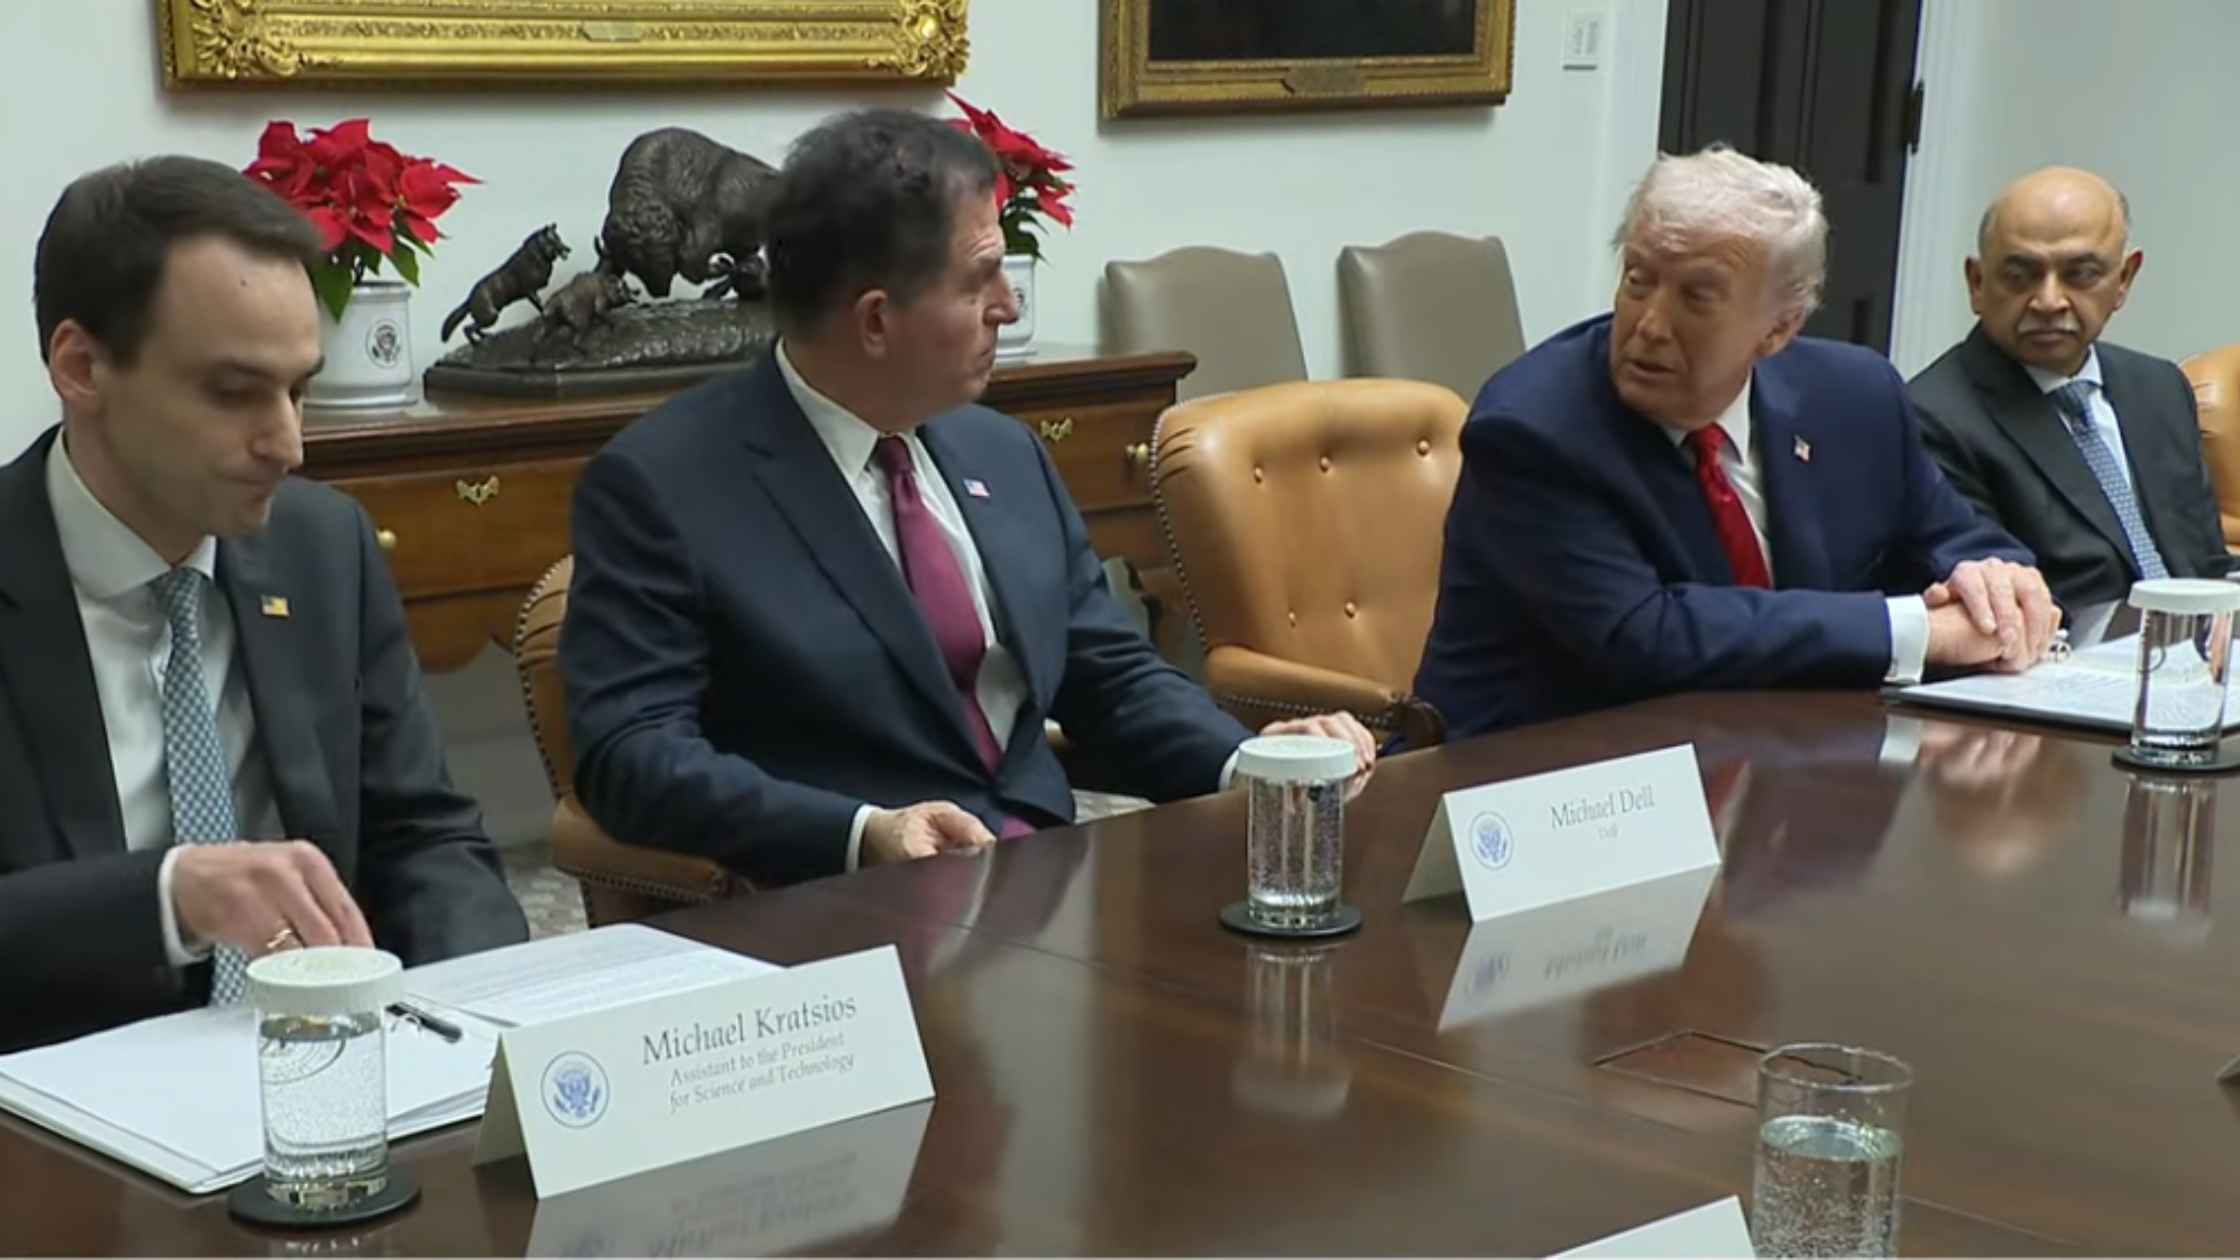
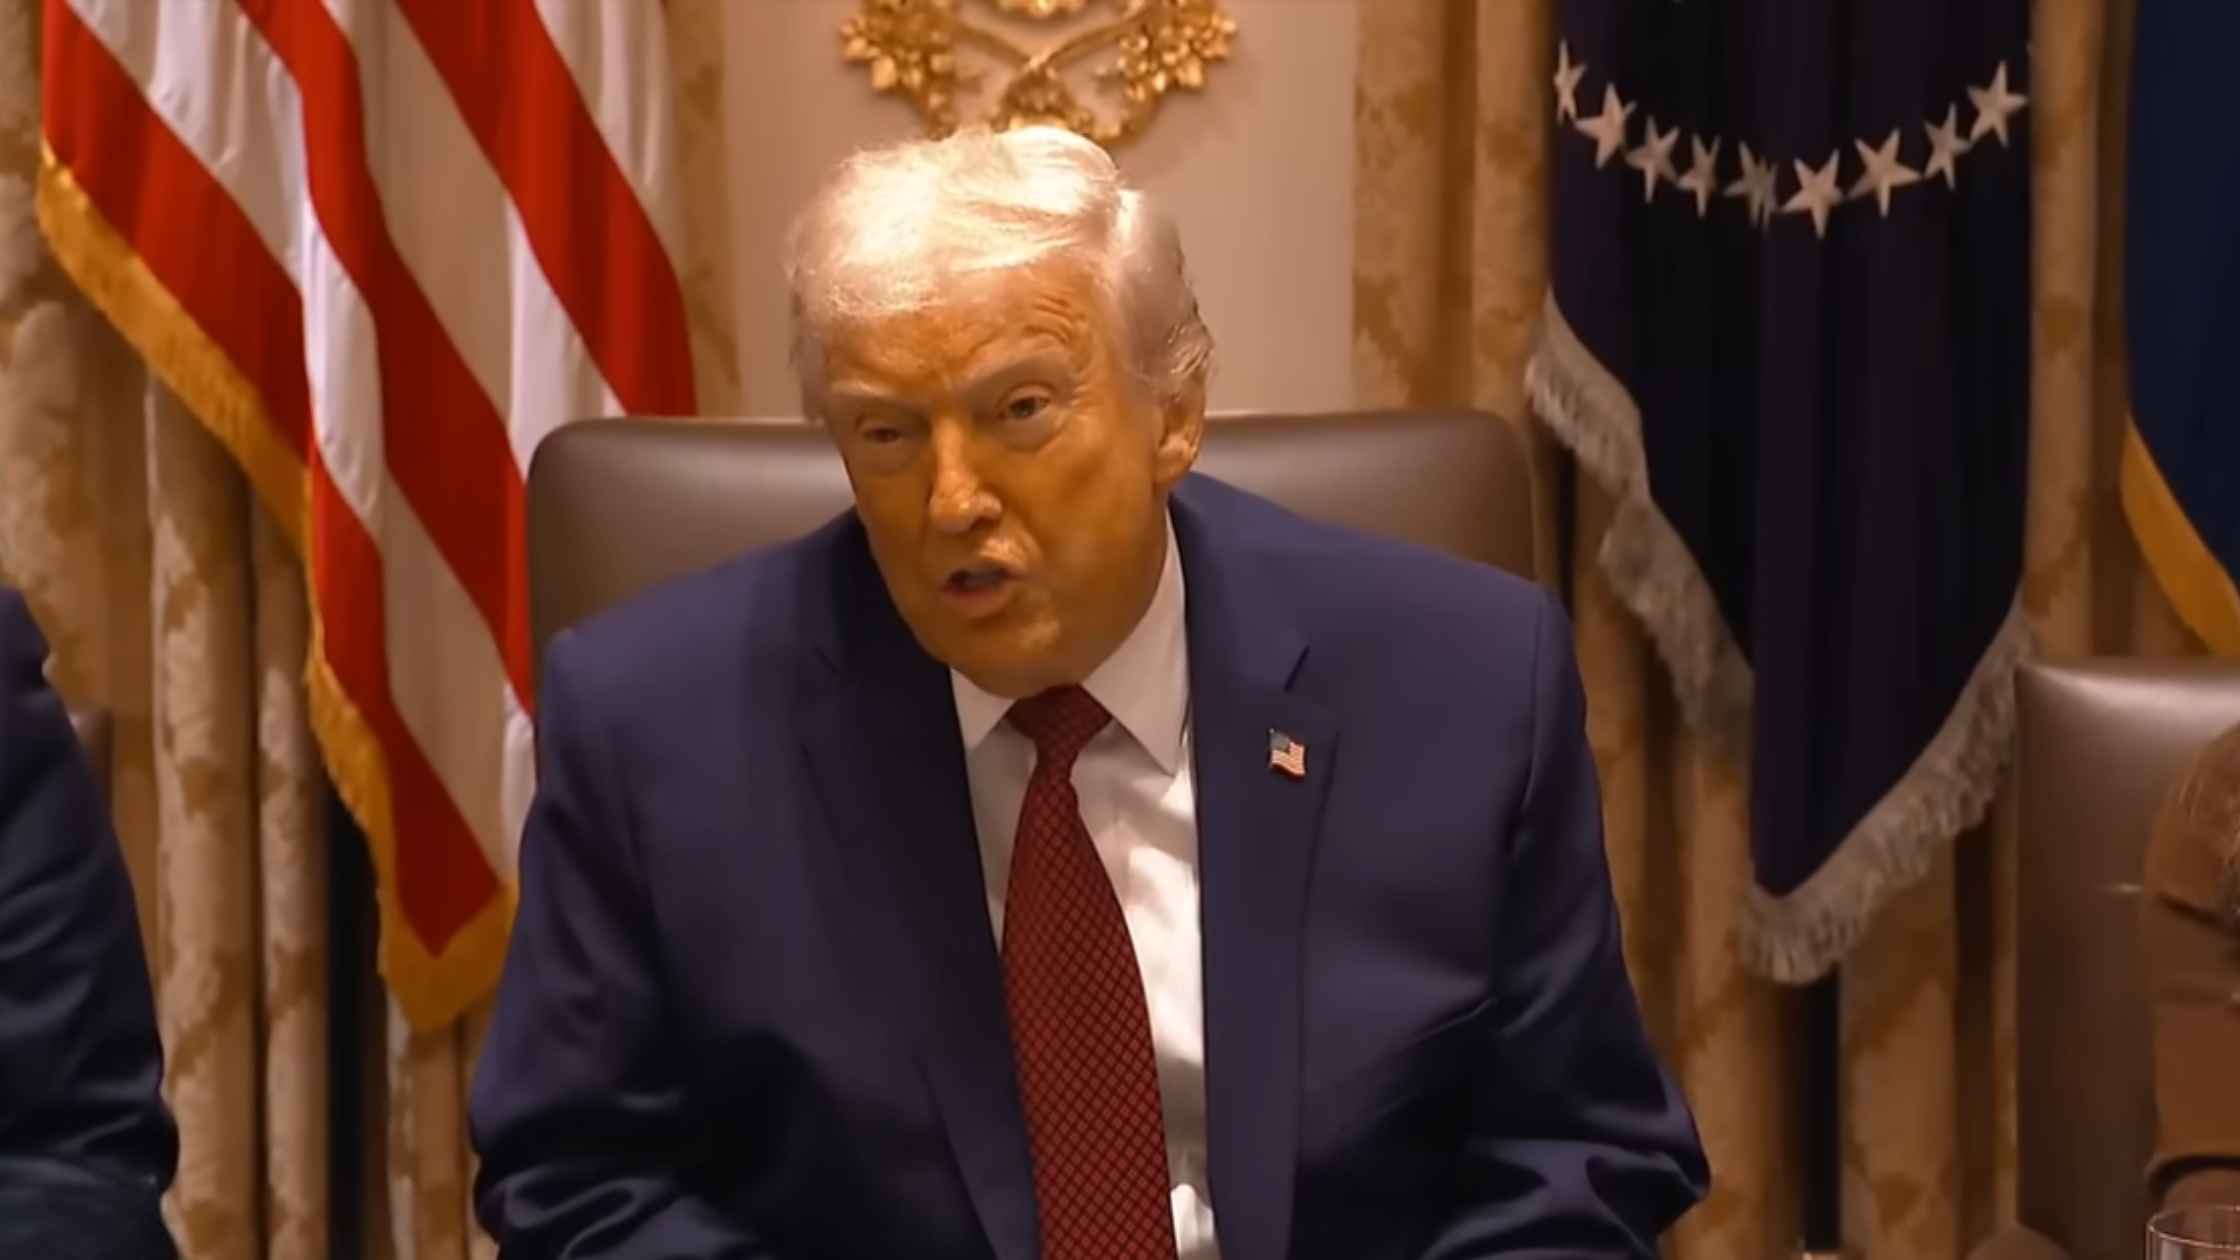
White House Technology Roundtable
Donald Trump holds a roundtable with business executives from top technology companies. Read the transcript here.
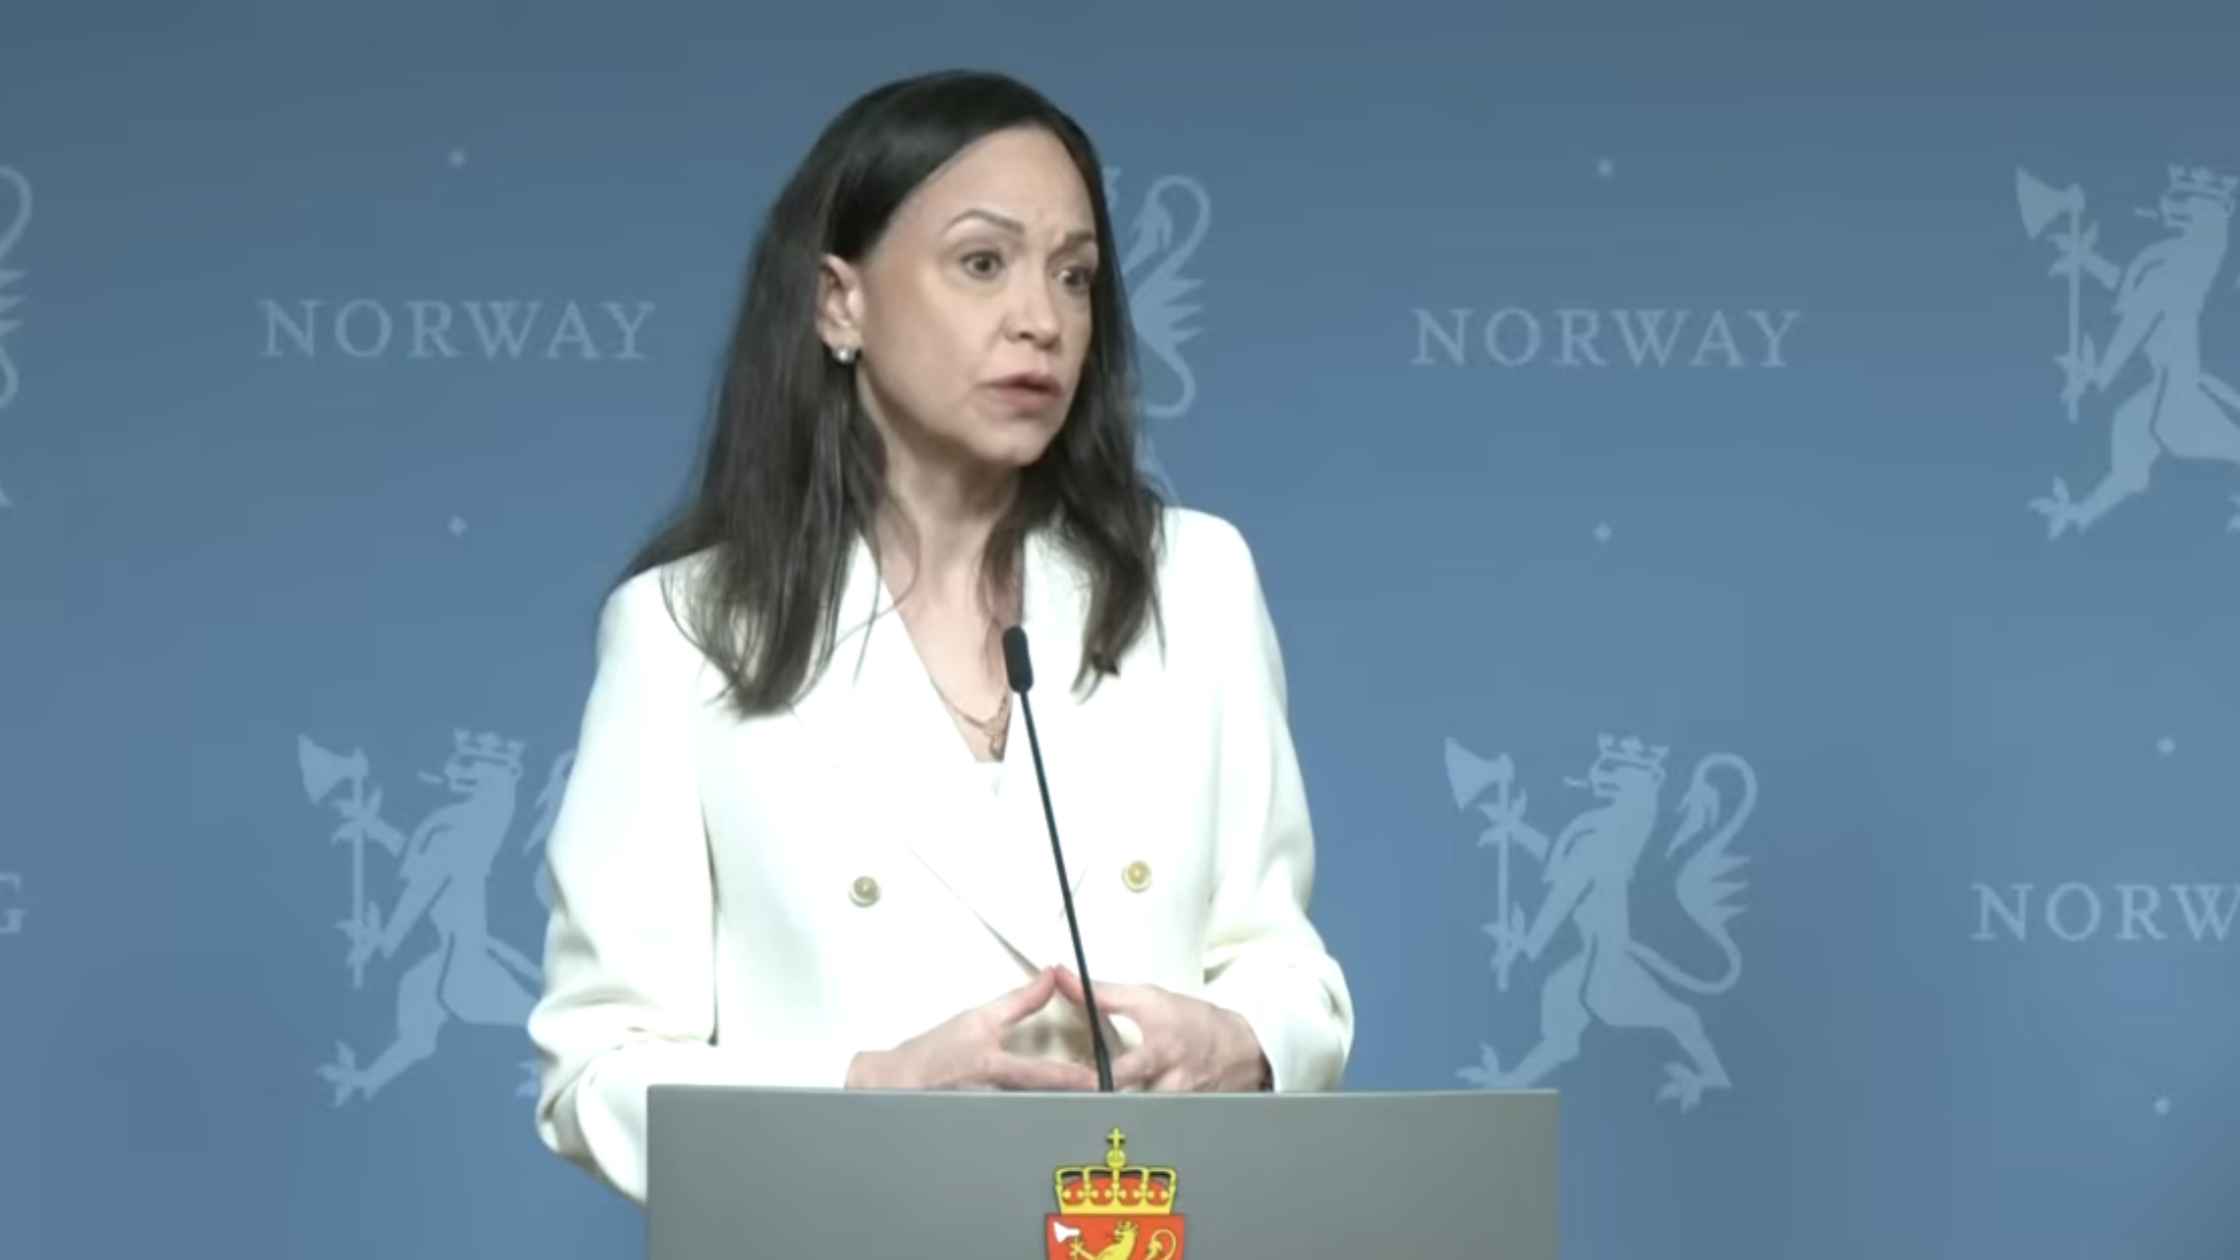
Nobel Winner Maria Corina Machado Holds Press Conference
Venezuelan opposition leader Maria Corina Machado holds a press conference the day after being awarded the Nobel Peace Prize. Read the transcript here.
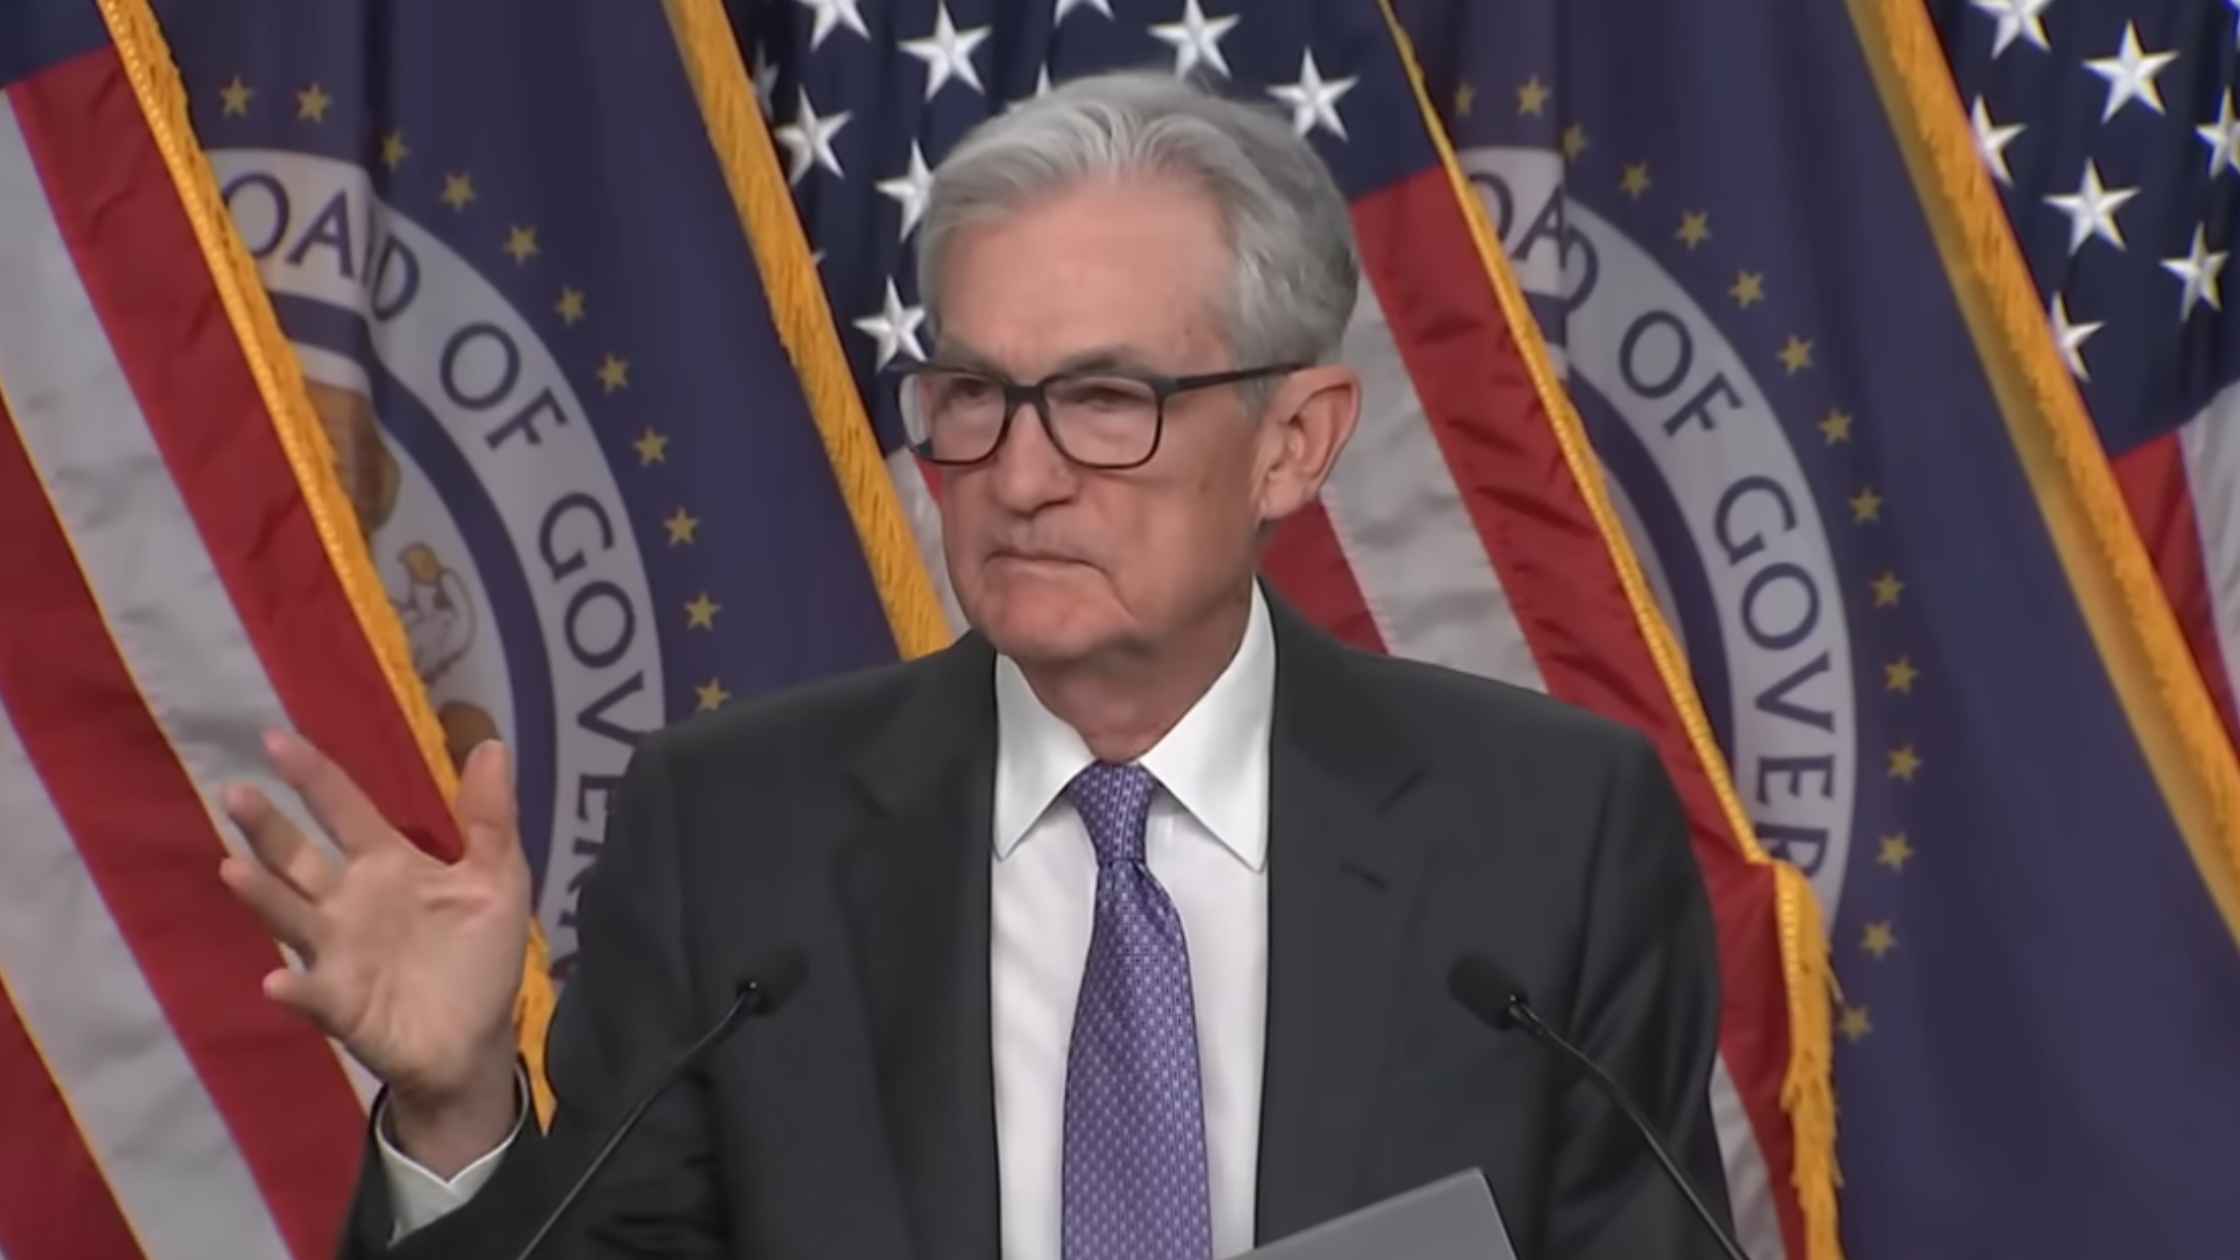
Federal Reserve Chair Jerome Powell Speaks After Rate Cut
Jerome Powell holds a briefing after the Federal Reserve cut interest rates in another divided vote. Read the transcript here.
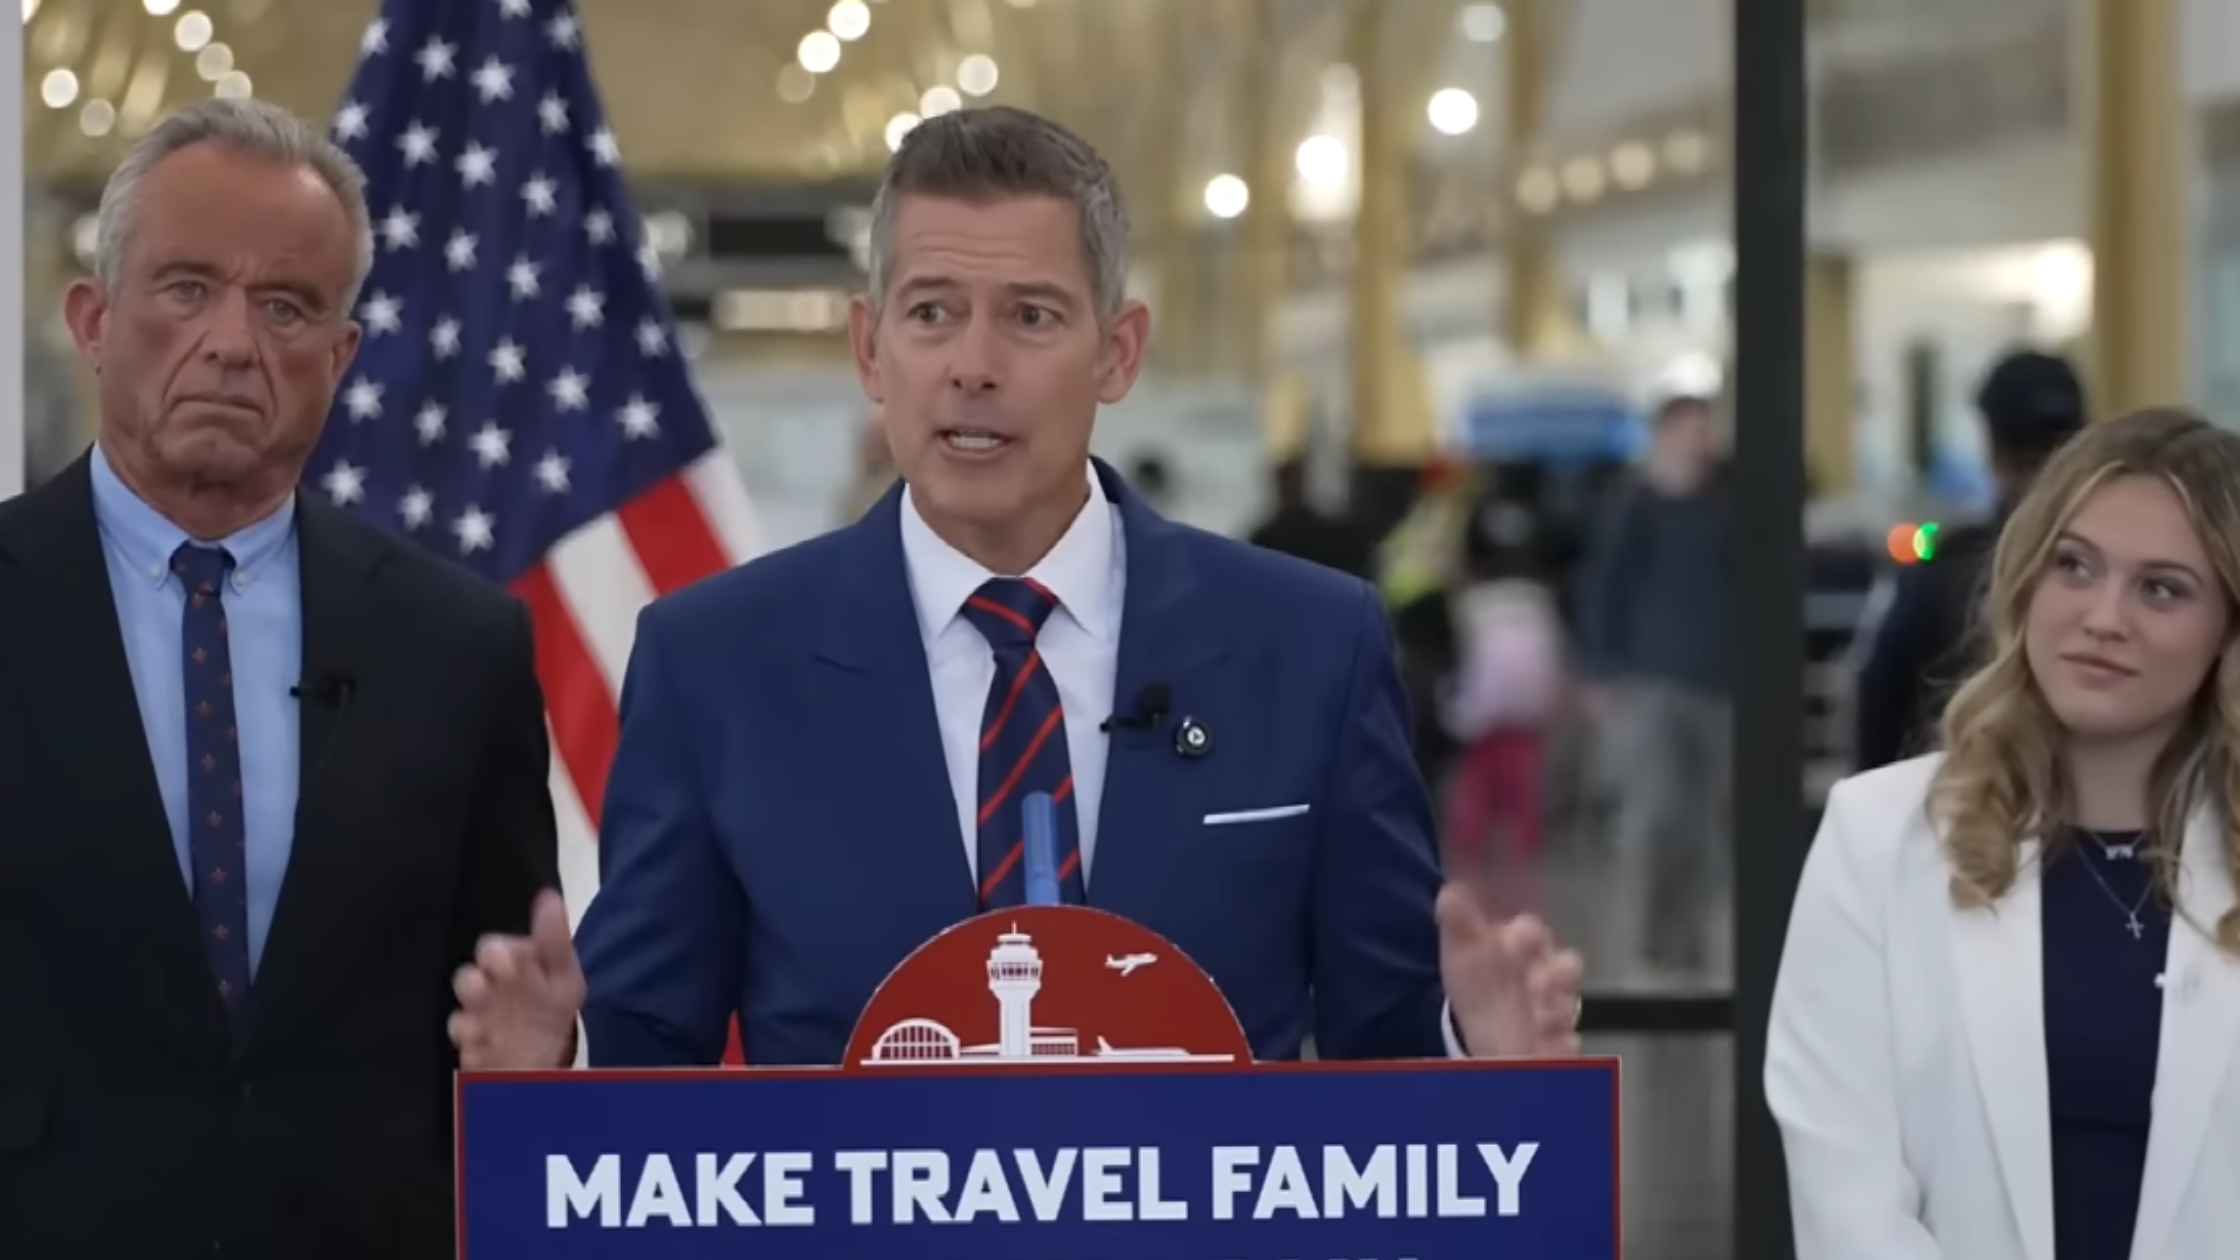
Airport Upgrade Campaign
Sean Duffy and RFK Jr. launch a new family-friendly travel campaign to upgrade airports. Read the transcript here.

Campaign Finance Limit Hearing
The Supreme Court hears challenge to campaign finance limits on political parties. Read the transcript here.
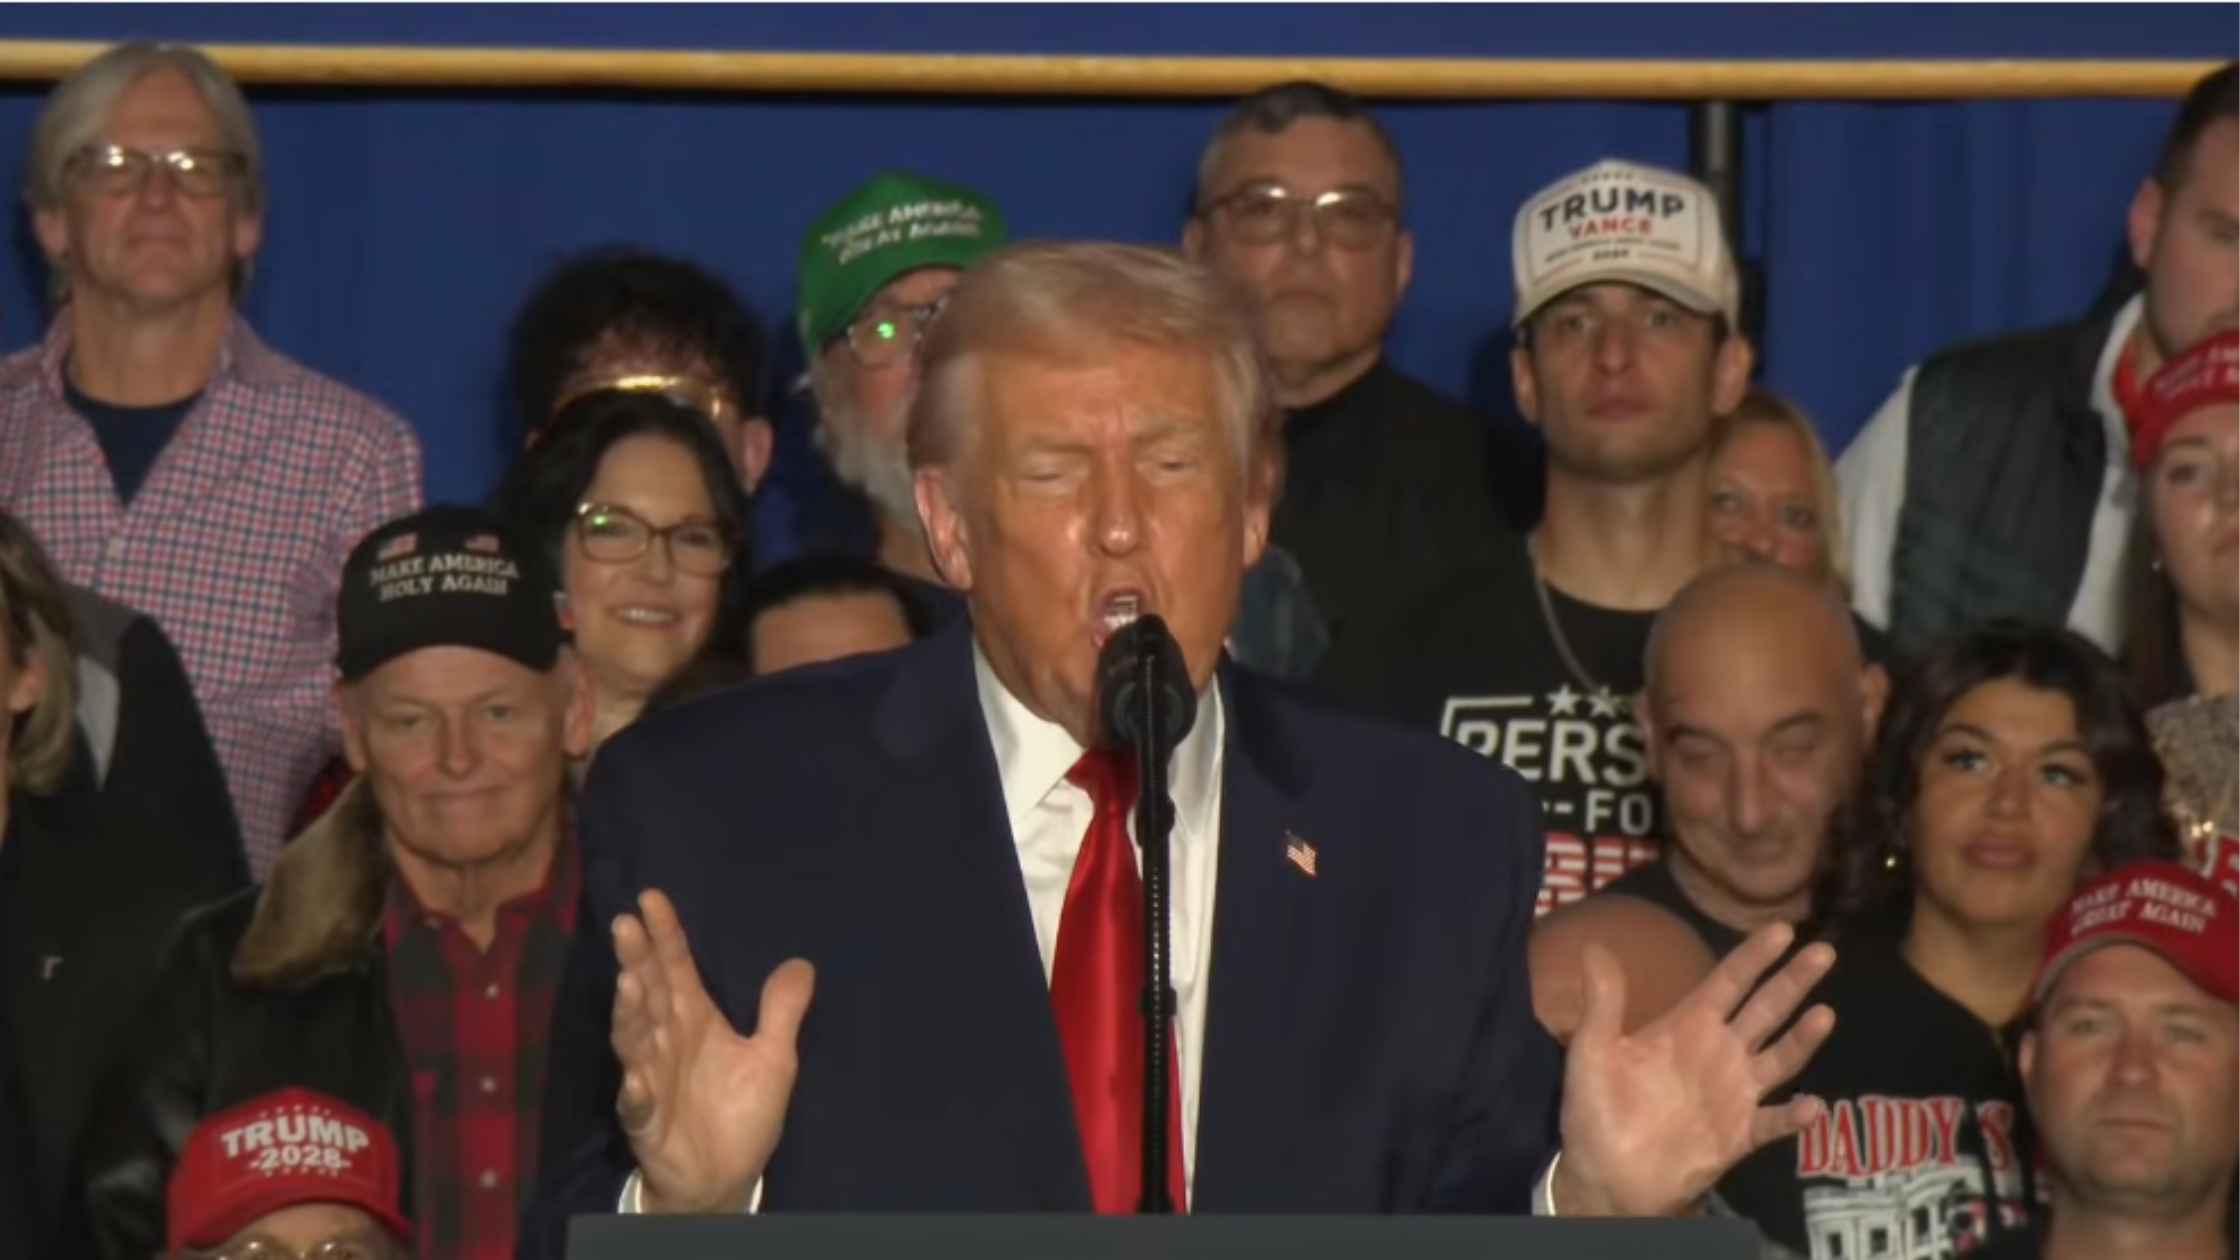
Trump Rally In Pennsylvania on 12/09/25
Donald Trump holds a rally in Mount Pocono, Pennsylvania, on 12/09/25. Read the transcript here.
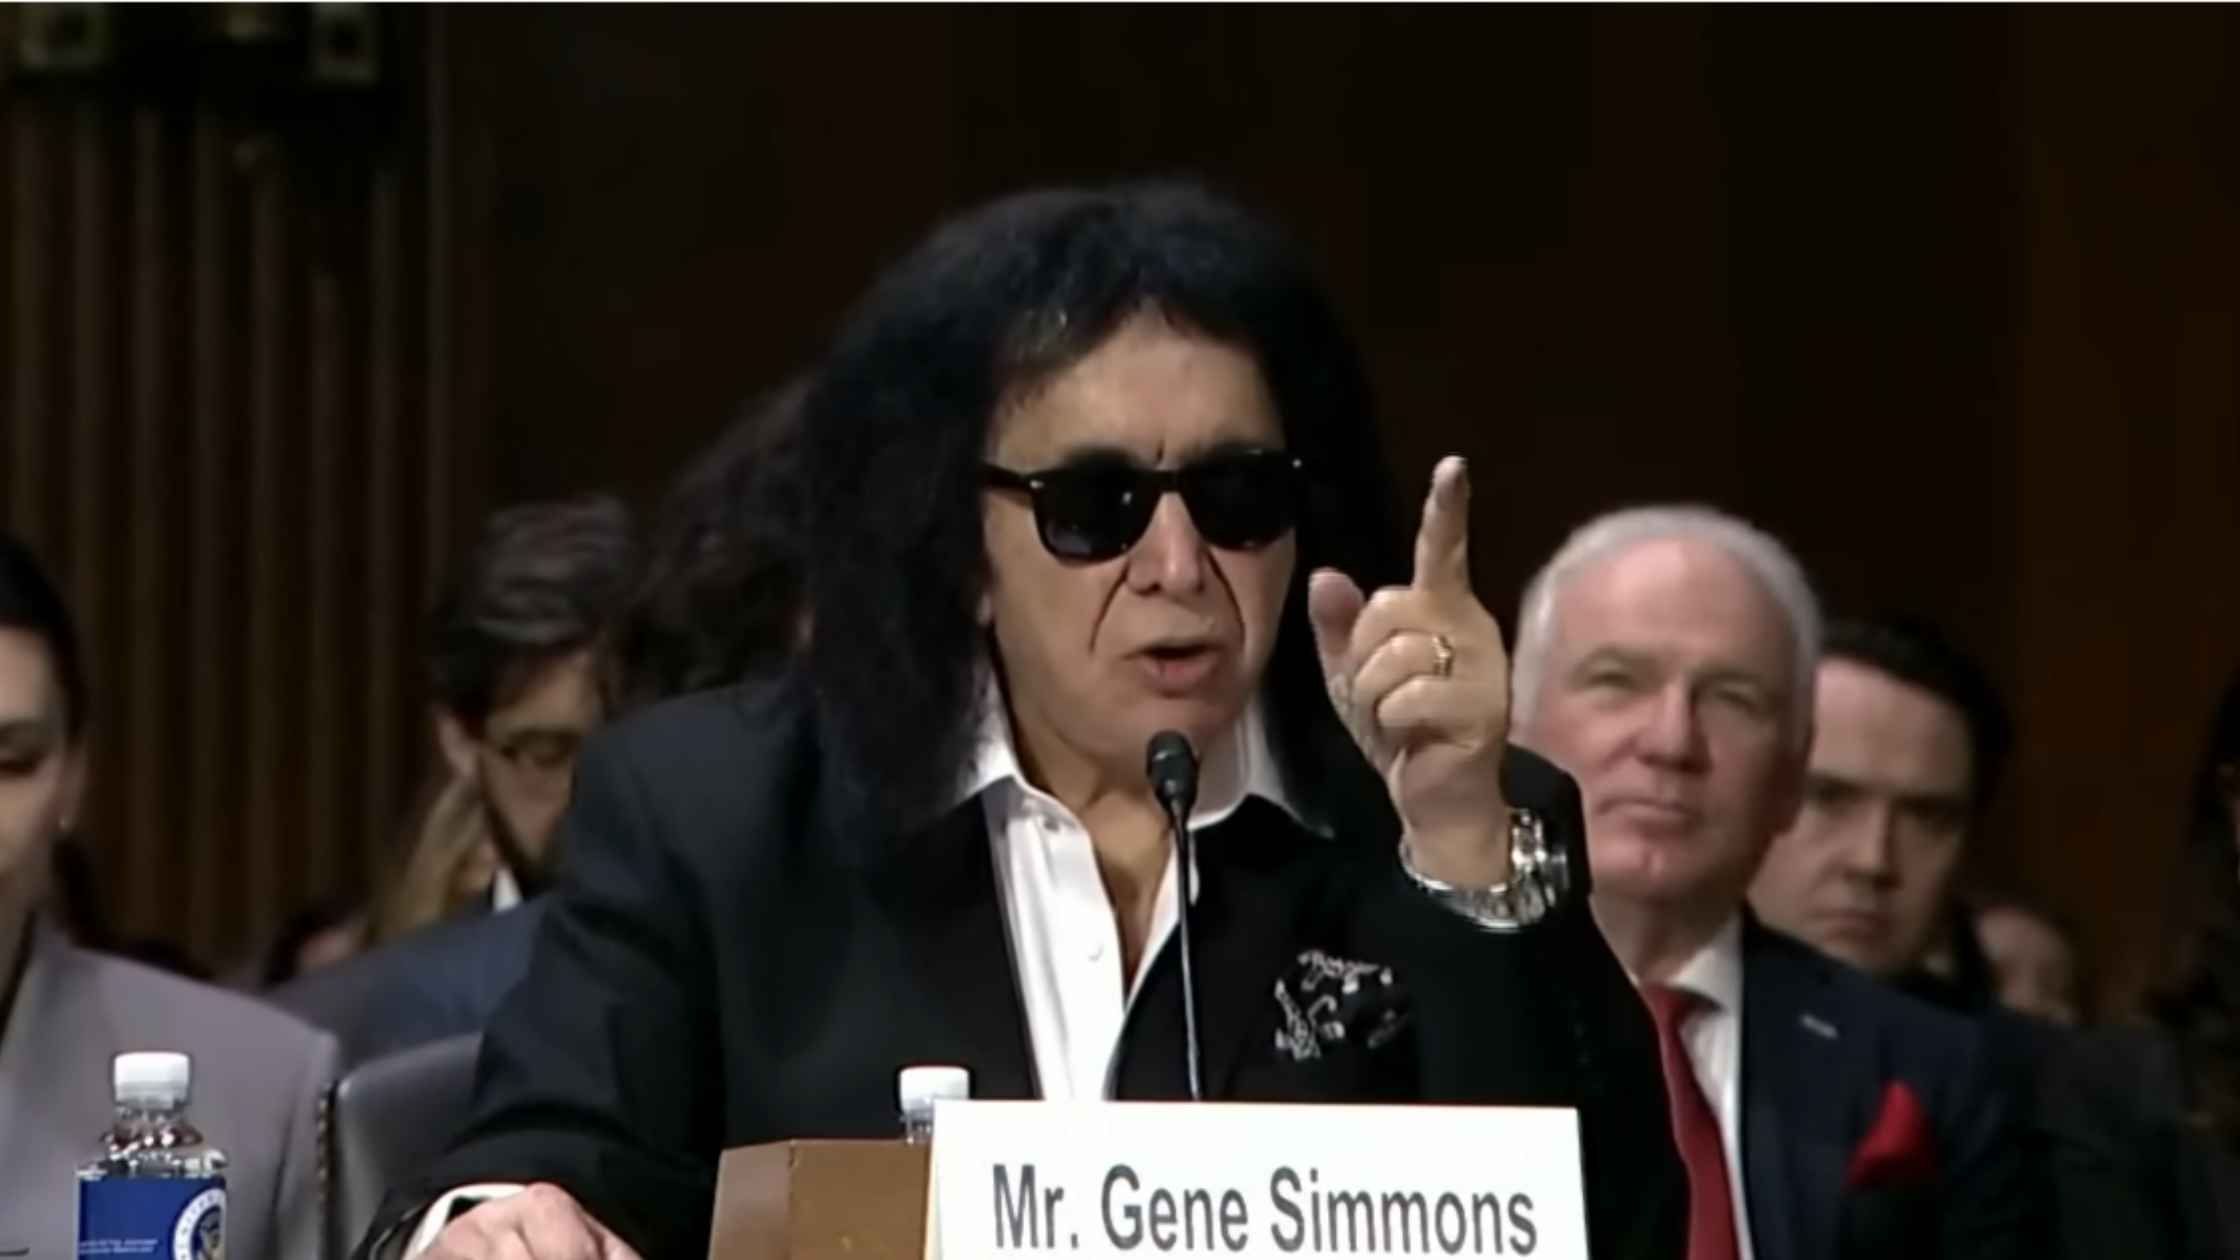
Senate Hearing on Protecting Songwriters in the Digital Age
Senate Judiciary holds a hearing on protecting songwriters in the digital age, featuring Gene Simmons from KISS. Read the transcript here.
Supreme Court Hears Arguments On Firing Of FTC Commissioner
The Supreme Court hears oral arguments for Trump v Slaughter, the case stemming from Trump's firing of the FTC commissioner. Read the transcript here.
American Farm Economic Assistance
Donald Trump announces a $12 billion economic assistance package for American farmers. Read the transcript here.
Subscribe to The Rev Blog
Sign up to get Rev content delivered straight to your inbox.